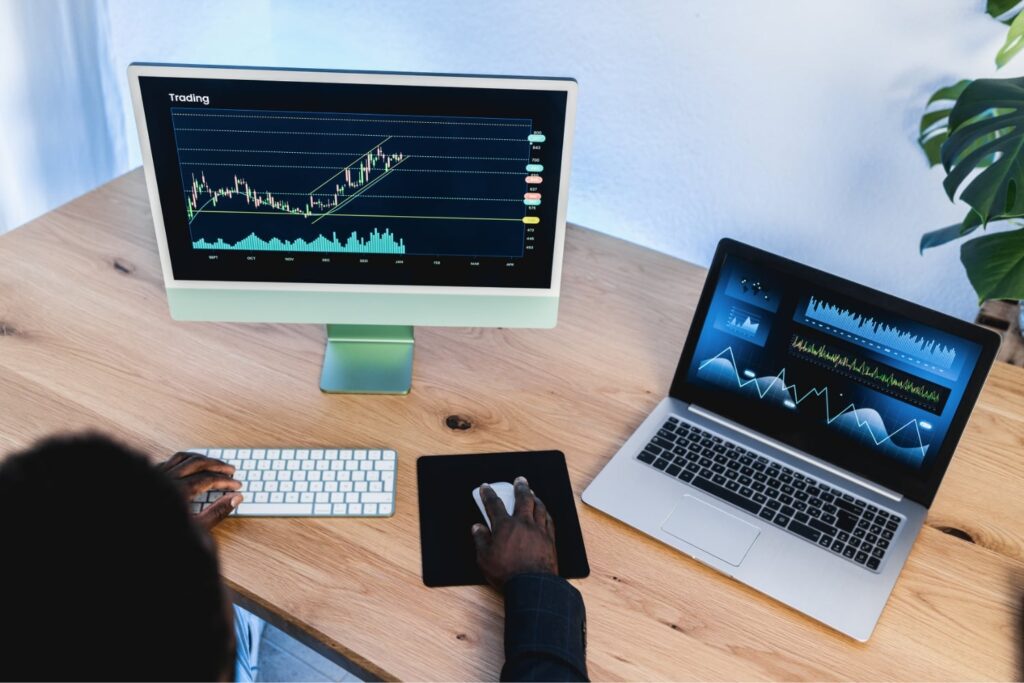
TradingView is one of the most powerful and user-friendly charting platforms used by traders worldwide. It allows you to analyze markets, track price movements in real time, and apply technical tools to identify trading opportunities. With TradingView, you can customize charts, use indicators, draw trendlines, and even share your analysis with a community of traders. Whether you’re a beginner exploring forex for the first time or an advanced trader fine-tuning your strategy, TradingView provides the flexibility, speed, and tools you need to make smarter trading decisions.
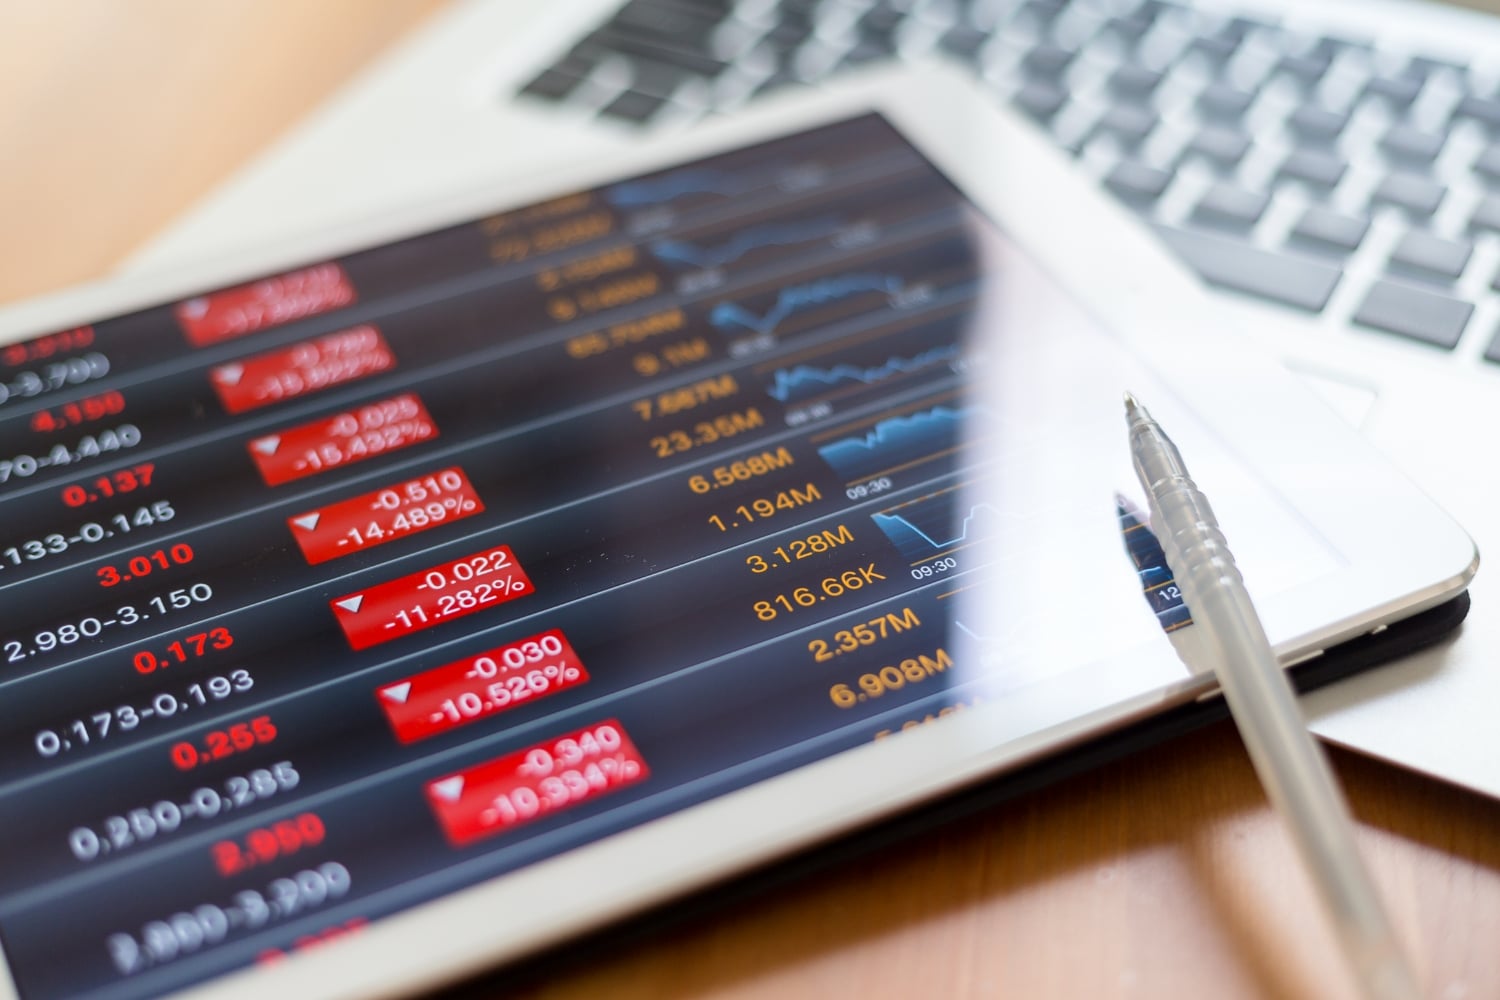
TradingView isn’t just a charting platform—it’s a complete trading toolkit. You get access to real-time data across forex, stocks, crypto, and indices, all in one place. The platform is web-based, so you can use it on any device without downloading heavy software.
### Key Features You’ll Learn to Use
* **Customizable Charts** – Adjust timeframes, change chart types, and save templates for your favorite trading setups.
* **Technical Indicators** – Apply tools like Moving Averages, RSI, MACD, and Bollinger Bands to analyze market conditions.
* **Drawing Tools** – Plot trendlines, Fibonacci levels, and support/resistance zones with ease.
* **Watchlists & Alerts** – Track your favorite instruments and get notified when prices hit your key levels.
* **Social Trading Community** – Share your ideas, follow other traders, and learn from published analyses.
To begin using TradingView, simply sign up for a free account, search for your preferred market (like EURUSD or XAUUSD), and start exploring the charts. From there, you can add indicators, draw analysis, and build strategies tailored to your trading style.
TradingView is one of the best platforms for applying technical analysis, giving traders all the tools they need to read and understand the market. With customizable charts, you can switch between different timeframes, spot candlestick patterns, and draw trendlines or channels with ease. TradingView also offers a wide range of built-in indicators such as Moving Averages, RSI, MACD, and Bollinger Bands, allowing you to analyze momentum, trends, and volatility in real time. You can save chart templates, set price alerts for key support and resistance levels, and even backtest strategies using TradingView’s advanced features. By mastering the technicals on TradingView, you can identify high-probability setups and make smarter, more confident trading decisions.
Beyond just indicators, TradingView helps you understand the language of the market through price action. By studying candlestick patterns, chart formations like head and shoulders or double tops, and the interaction between price and key levels, you’ll gain deeper insight into how traders and institutions move the market. This knowledge allows you to anticipate possible reversals, continuations, and breakout opportunities. Learning these technical skills not only sharpens your analysis but also builds the confidence to make independent trading decisions without relying solely on signals.